Stochastic Gradient Descent
Demonstrate SGD - the essence of Machine Learning
Overview
ML is basically this - you make a prediction, see how far that prediction is from the truth, fine-tune your prediction and keep going until the difference between between the prediction and the actual reaches an acceptable level. If we imagine the loss function plotted as a U curve then we are trying to reach the bottom of the curve as quickly as possible ie minimise the loss. From our starting point, a guess, we then take a small step in the direction of lower loss. The small step is known as the learning rate and the direction of lower loss is worked out from the slope of the curve.
Minimising the loss
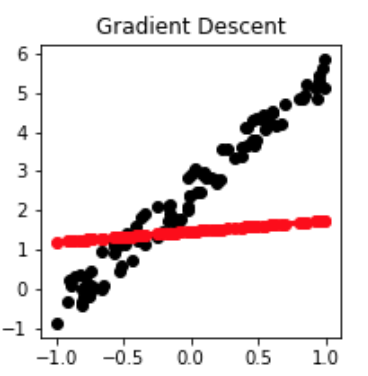
Below is a regression example. The pink dots are the initial set of data. To this we have to find a general approximation that will satisfy any new points.
Our initial guess is the black line.

We then go through the fllowing sequence: Loss = New Value - Actual Value Find slope of the loss function Move down the loss curve by a small amount (the Learning Rate) Find the new loss
Pytorch implementation
y is the actual
y_hat is the prediction (based on a set of weights a)
loss is the mean squared error between y_hat and y


def mse(y_hat,y):
    return((y_hat-y)**2).mean()

def update():
    y_hat = x@a
    loss=mse(y_hat,y)
    loss.backward()
    with torch.no_grad():
        a.sub_(lr * a.grad)
        a.grad.zero_()
References
D
![]() —
—

